
Get an as-is cash offer for your home
"*" indicates required fields
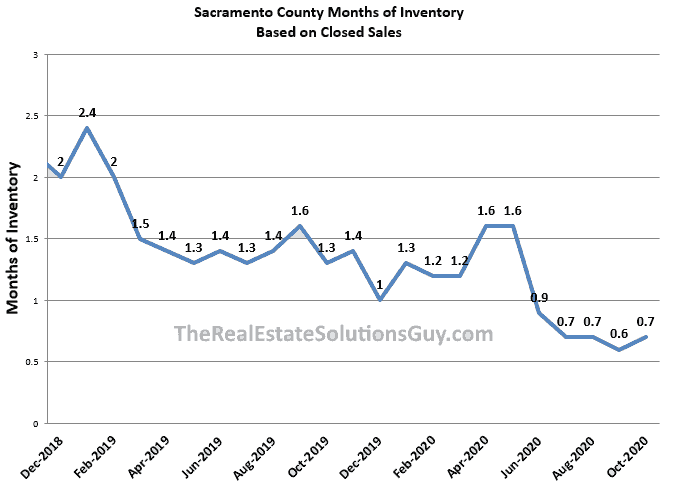
Sacramento housing inventory lowest in years
Sacramento’s housing inventory is the lowest it has been in years. In April we suggested that housing would not be negatively impacted by the pandemic. We anticipated that if the United States was anything like China’s recovery, housing would take a “V” shaped dip, but recover quickly. What we didn’t anticipate was the impact working remotely, and migration from urban areas would have on real estate, especially in the Central Valley.
18 days of inventory in October
In September, Sacramento’s housing inventory dropped to just 18 days (0.6 months) of inventory. Housing inventory is typically measured in how many months it takes to sell every house currently listed for sale, based on the current volume of sales. If 100 houses a month are being sold, and there’s 300 houses, for sale, the inventory is considered to be 3 months long (300/100=3).
In years past, a normal inventory level was 6 months, but that hasn’t existed since the beginning of the Great Recession.
The previous sustained inventory low was the Spring of 2017. However, inventory numbers began to climb steadily in the summer of the following year when in December of 2018 Sacramento inventory reached a peak of 2.4 months. But since the Spring of 2019, Sacramento housing inventory has remained below 2 months supply.
With the advent of the COVID-19 virus, and the influx of Bay Area buyers, Sacramento’s inventory has taken a significant drop remaining under one month of inventory since the pandemic started.
Largest decline in inventory Year over Year
Inventory has been steadily declining for several months. At the end of 2019 and beginning of 2020, the number of homes for sale was 42% less inventory than the previous year. It increased slightly during the first few months of 2020, but took a nose dive starting in April, dropping to 50% lower than the same time last year.
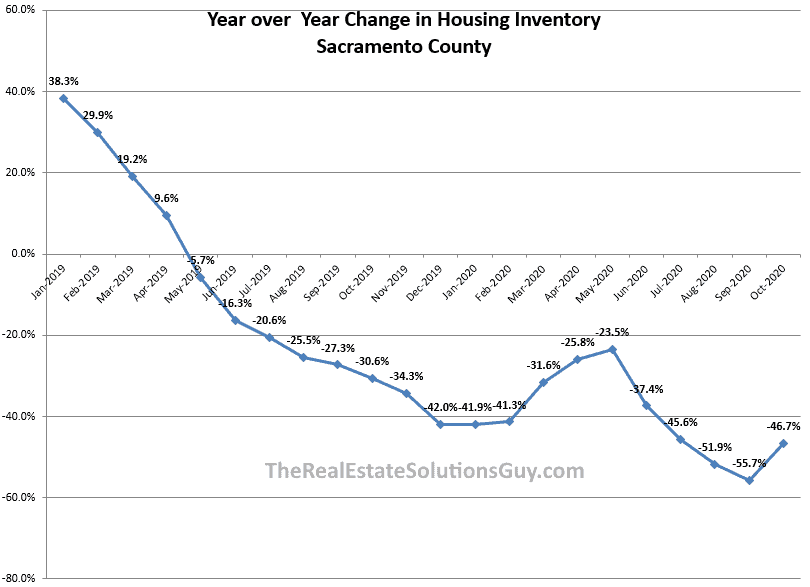
Percentage Change in Sacramento Housing Inventory
Housing sales outpace listings
In a first for us since we began tracking Sacramento real estate in 2007, the number of homes sold was more than the number of homes listed for sale.
Note the blue lines indicating Sold homes in the chart below. Generally, these numbers are always less than the number of homes for sale in red. Some homes are priced too high, while others have a difficult time selling due to condition, location or other problems. As a result, pattern in the number of listings lags the number of sales. But notice that in June of this year the number of homes sold exceeds the number of homes for sale.
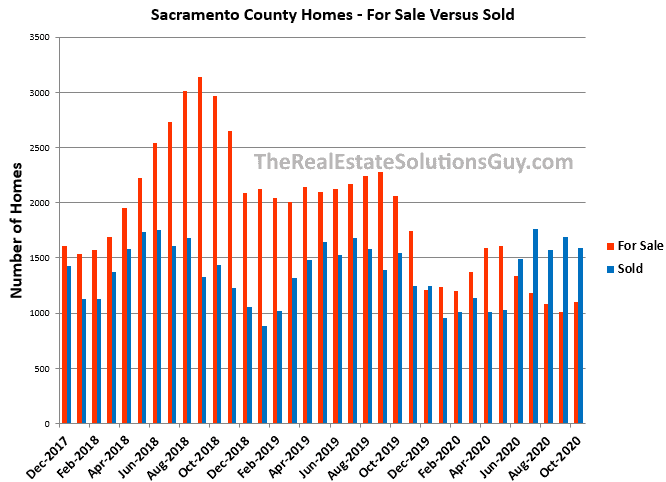
This happens when buyers begin to consume all of the inventory that had previously been bypassed. This may have included homes in disrepair or severely dated. With large influx of buyers moving to Sacramento and limited inventory, buyers are resorting to buying homes that they may have previously avoided.
Good for sellers, bad for buyers
This has been great for home sellers, even if they have distressed properties. But if you’re a buyer, you are encountering lots of competition.
A Realtor® recently told me they were competing against 14 offers on a home that needed several thousand dollars in pest work. I overheard another agent telling their clients who were waiting in line to see a home, that they may need to be willing to buy a home that needed repairs or that they may need to overlook the dry rot.
Median sale price up 14% YoY
The surge in demand along with the extremely limited inventory has created a sellers’ market unlike anything in recent years. This has caused median home prices to increase 14.28% since November 2019. This is only slightly less than the national average which has seen a 15% increase in year over year home prices according to Refin. However, in just the past six months, median home prices have increased 10%!
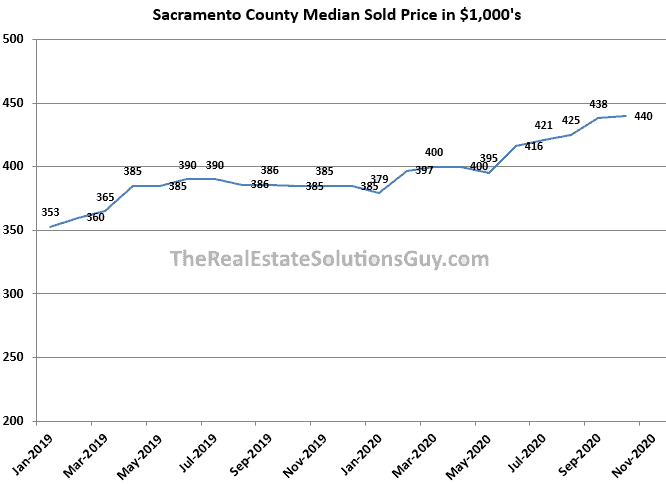
2 Year Median Home Prices
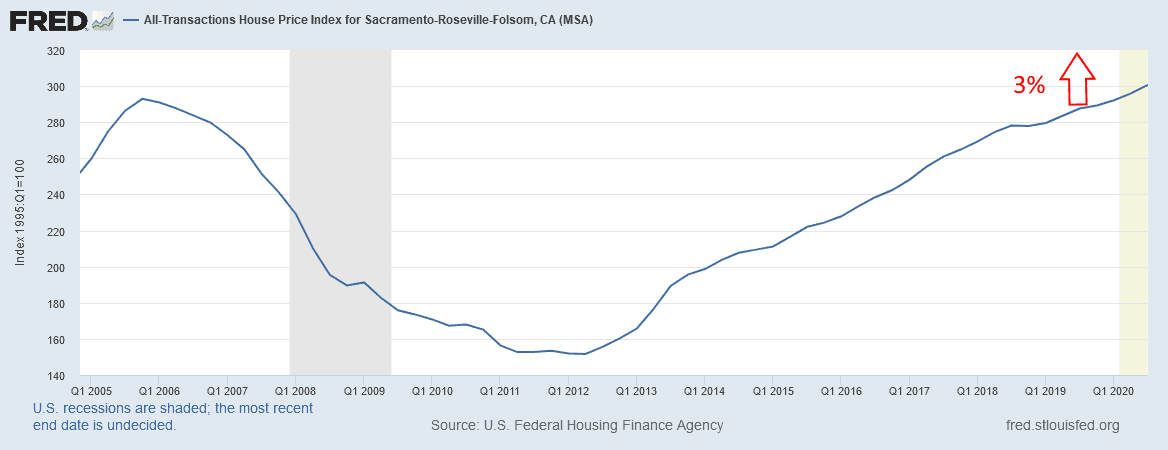
Sacramento home prices pass 2005 peak
Additionally, the Case Schiller housing price index released this week shows that this last quarter, Sacramento finally surpassed the 2005 peak in housing prices. The Case Schiller Index is different from most other housing indexes. Most indexes track the median price by metro area. However, the Case Schiller Index tracks prices by individual house, using the price your home has sold for over the years. This is considered to be more reliable than using median prices between different houses and subdivisions. Additionally, the Case Schiller Index adjusts prices for inflation (unlike the median price chart above), giving a more accurate comparison over time.
At the beginning of 2020, the Sacramento index was just under the 2005 peak ($292.2 vs $292.9). Since that time, Sacramento housing prices have been pushed to over $300,000. In inflation adjusted dollars, Sacramento homes are now $9,000 more expensive than they were in the peak of 2005 before the bust of the Great Recession.
The sweet spot
The majority of home sales in Sacramento have been in the $250,000 to $500,000 price rage. While some may assume that Bay Area buyers are buying up, the evidence appears to indicate otherwise. Bay Area buyers appear to be looking for bargains compared to Bay Area home prices. In the $250K to $500K price range, most buyers can buy nice entry level homes and even some move up homes in the Sacramento area. There are obvious neighborhoods and suburbs that are exceptions, but most buyers seem to be looking to stay under the $750K price range.
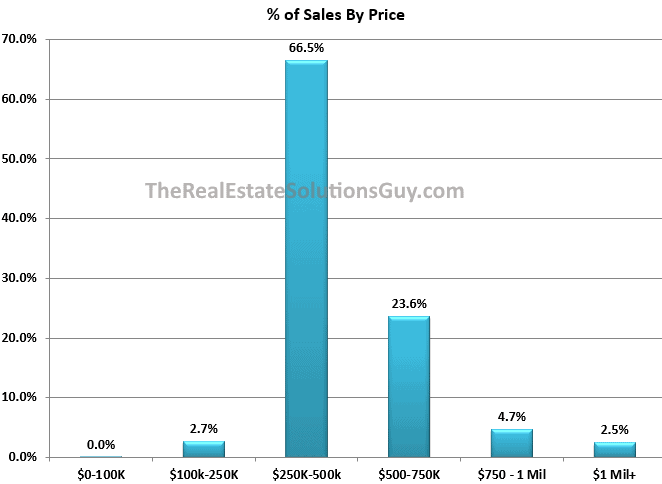
Sacramento Home Sales by Price Point
Homes for available under $500K decline
What shouldn’t be a surprise with the increase in home prices, is the decline in entry level homes. We wanted to know what difference was before and after the pandemic began. We charted March 15 through November 1 to compare home sales pre and post COVID 19. The number of lower priced entry homes has significantly dropped in the past year. The number of homes priced below $250K dropped by 59%. Meanwhile, there has been a combined 49% increase in home sales in the $750K+ ranges.
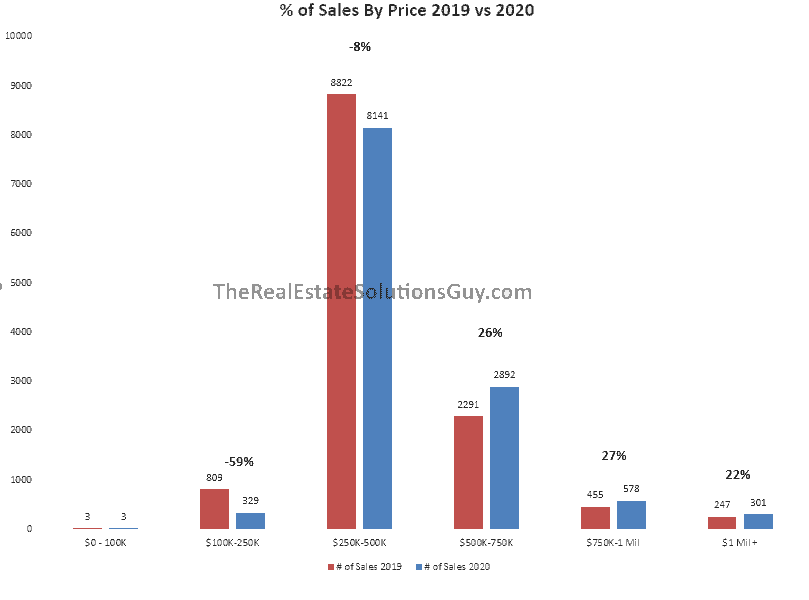
Sacramento Home sales pre and post COVID 19 (March 15-November 1)
Conclusion
The pandemic has caused real estate markets to shift dramatically. This shift is happening along two fronts. The first has been geographical as home buyers move from congested, expensive cities to more affordable inland areas. The second has been an upward swing in inland home prices as well as declining demand in the Bay Area. How long this shift will last is anyone’s guess. However, homeowners wishing to sell, should be planning to take advantage of the market to sell this next Spring.
For more information about the best time of the year to sell your home in Sacramento, check out What is the Best Time of Year to Sell your Home.