
This past week the US Census Bureau released their report for December 2018 home sales. Due to the government shutdown, the data was released later than normal. This report is produced in conjunction with the Department of Housing and Urban Development (HUD). The numbers are fluid and are often updated several months after release. Still it can be helpful in evaluating where the housing market may be heading.
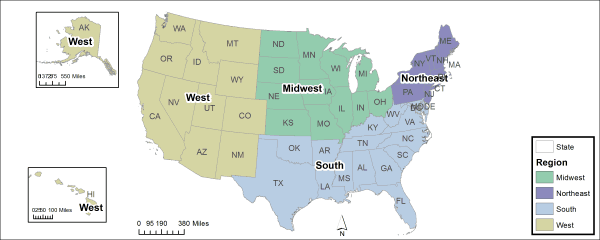
The numbers don’t look too alarming, unless you look specifically at the Western United States. The Census Bureau divides the US into four regions. The Western US region is identified in yellow region in the image below.
On the national level, we are seeing a healthy level of inventory for sale in relation to the number of sold homes. Months of inventory has long been the standard measurement of a healthy real estate market. It is calculated by diving the total number of homes for sale by the number of homes sold. Currently months of inventory is around five to six months at the national level. Six months of inventory has traditionally been considered a balanced market.
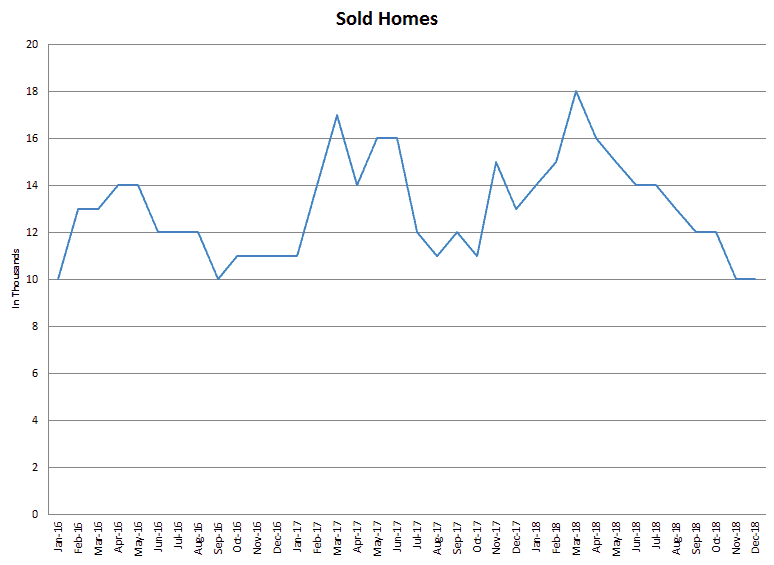
Numbers of Sold Homes
In the West, the number of monthly sales has remained relatively stable. There are the obvious, but expected peaks. Mainly during Spring when families are considering moving as soon as their children are out of school. Beyond these peaks, we are averaging between 12,000 and 15,000 homes per month being sold.
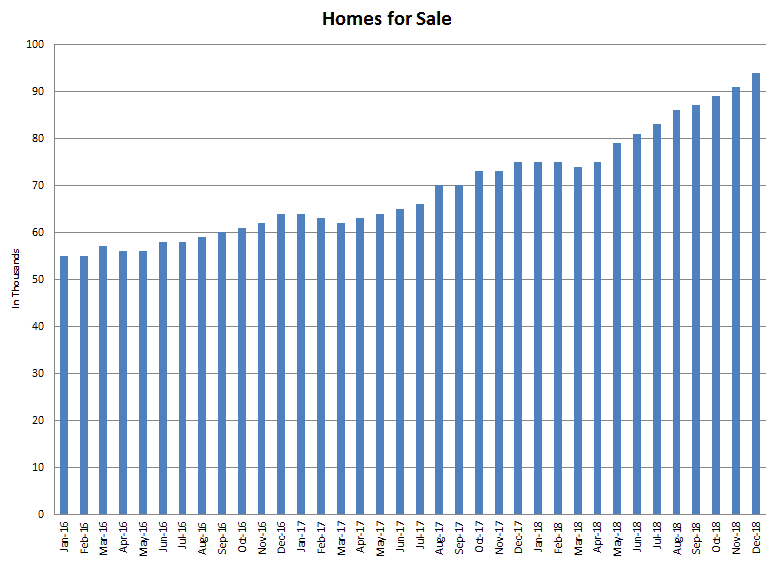
Number of Homes for Sale
On the other hand, the number of homes being listed on the market has shown a steady increase for the past three years. Home owners who have been underwater are finally getting out from underneath their homes and trying to cashing in on their equity. Meanwhile, new construction continues to increase the number of homes on the market.
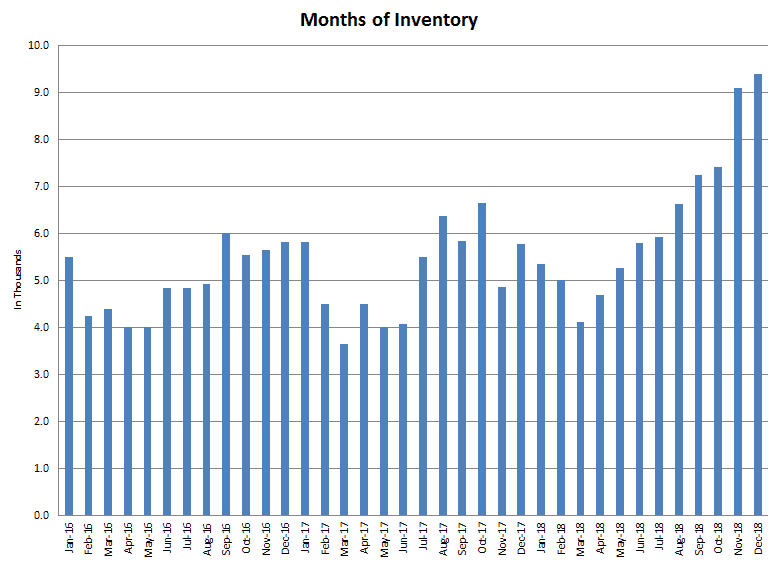
Months of Inventory
The increased number of homes for sale, in combination with the flat demand from buyers, has created a 50% increase in the months of inventory at the current pace. Remember that months of inventory is the total number of homes for sale divided by the number of homes being sold. Six months of inventory was until the Recession, considered healthy.
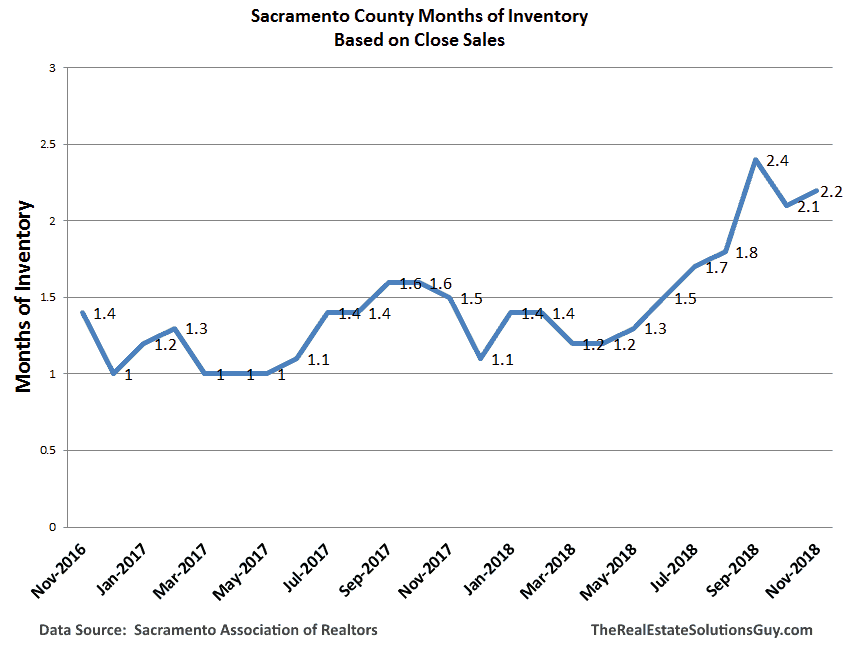
Sacramento inventory levels
Since the Recession, local markets in California have averaged around two months of inventory. This past few months, the Sacramento inventory levels have pushed over two months for the first time in several years.
Real estate is local and comparing the local Sacramento market to national numbers is problematic. However, both areas continue to show rising inventory levels.
The National Association of Realtors reported that homes sales are down 15.4% from a year ago. Their chief economist, Lawrence Yun stated, “A marked shift is occurring in the West region, with much lower sales and very soft price growth” It is predominant in the West according to Yun “where consumers have expressed the weakest sentiment about home buying, largely due to lack of affordable housing inventory.”
New home builders are also seeing the glut of inventory and a decrease in demand. As we reported in December, “Toll Brothers announced that they were cutting their projections for 2019. Toll Brothers orders for new homes dropped from 1,715 to 226 homes in California from the same time last year.”
If you were waiting for the market to peak, you may have missed it. If you were waiting for a chance to buy a home at a more affordable price, your turn may be coming.