December 2018
For the most recent data from 2020, check out our latest analysis at Sacramento Housing Inventory is the Lowest in Years
Housing supply continued to climb in Sacramento as more homes were listed for sale than were sold. During the same time, the number of buyers dropped slightly. Months of inventory is calculated by dividing the number of homes listed for sale by the number of homes sold during the same period. The result is the number of months to sell every house if no more houses become available to sell.
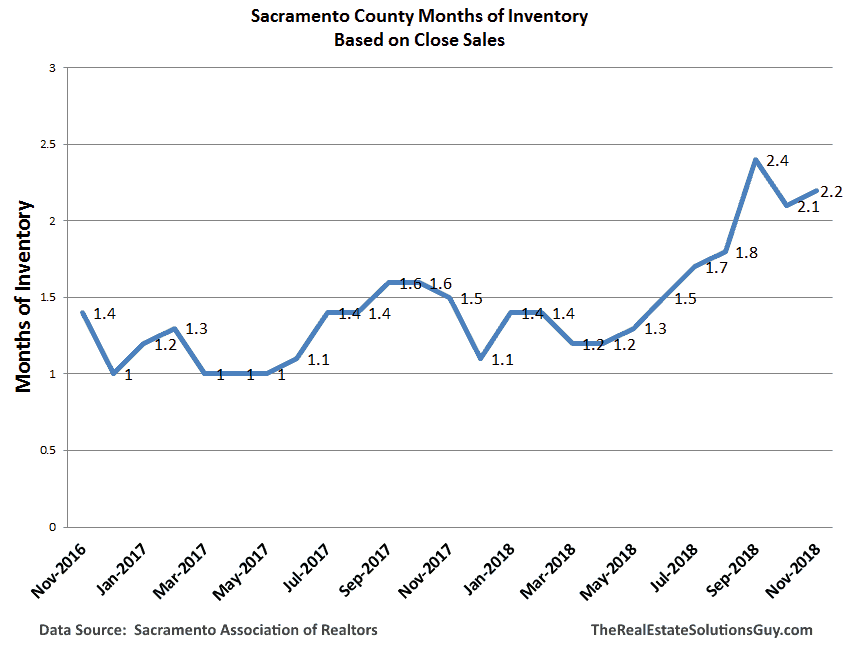
Historical norms have been 5-6 months of inventory. However, during the last 10 years one to two months of inventory has been more typical. Recently, agents have been saying, “Two months of inventory is the new normal.” If the trend continues that number may increase.
New Home Demand is Down
Nationwide, inventory of new homes hit 7.4 months, the highest level since 2011. This is up from 5.6 in November of 2017. In their quarterly filings, Toll Brothers announced that they were cutting their projections for 2019. Toll Brothers orders for new homes dropped from 1,715 to 226 homes in California from the same time last year.
For Sale versus Sold
During the previous six months the number of homes for sale in Sacramento has increased by 25%. However, the number of buyers has remained relatively the same.
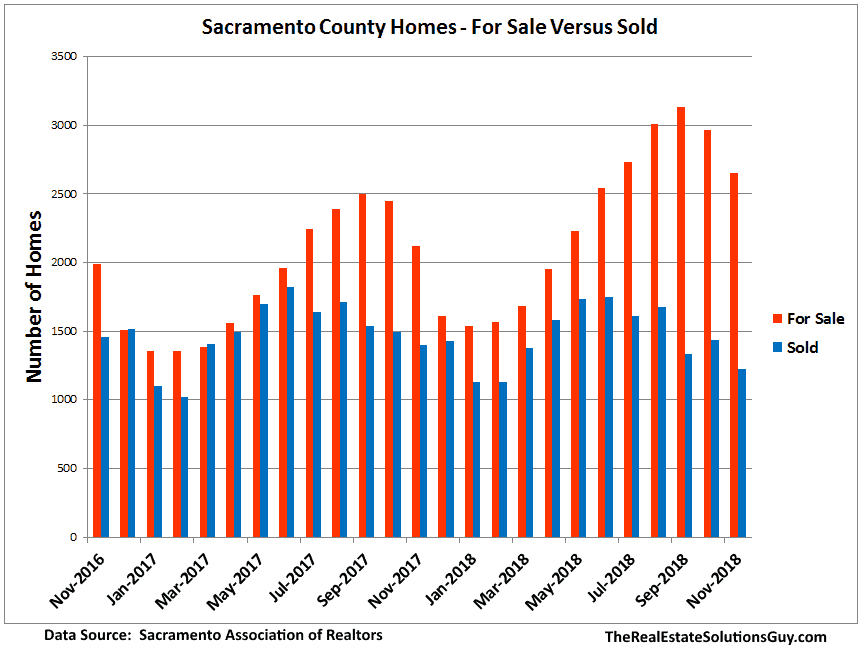
This explains part of the reason for the increased months in inventory. A 25% increase in new listings, but no increase in the total number of buyers. This is in keeping with the slowdowns seen in Phoenix and Las Vegas housing markets. An article published last week in the Wall Street Journal said, “The national housing slowdown is spreading to markets like Las Vegas and Phoenix.” The article went on to say that in the Las Vegas market, “Existing home sales slowed nearly 12% in November compared with a year earlier” while existing inventory has nearly doubled.”
Existing Home Sales Drop 15.4% in the West
A December report by the National Association of Realtors puts home sales modestly up in 3 of 4 regions. However, they acknowledge that in the Western Sales region, existing homes sales are down a whopping 15.4% from a year ago. According to the National Association of Realtors economist, Lawrence Yun, “A marked shift is occurring in the West region, with much lower sales and very soft price growth” It is predominant in the West according to Yun “ where consumers have expressed the weakest sentiment about home buying, largely due to lack of affordable housing inventory.”
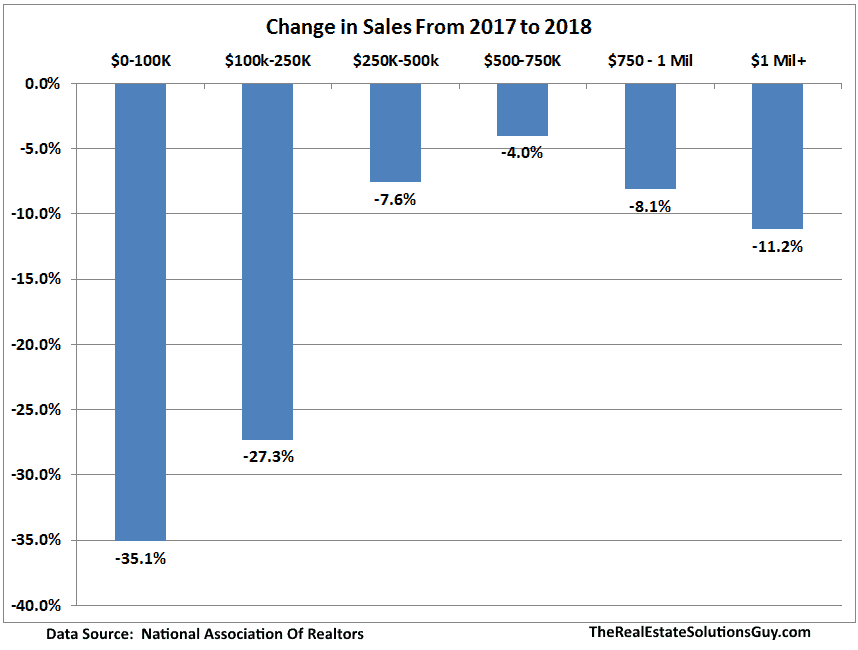
The biggest area of declining sales is in entry level homes. This actually makes sense as the median home price continues to increase. It would be very difficult in most cities in the West to find a home under $200K that anyone other than an investor would buy.
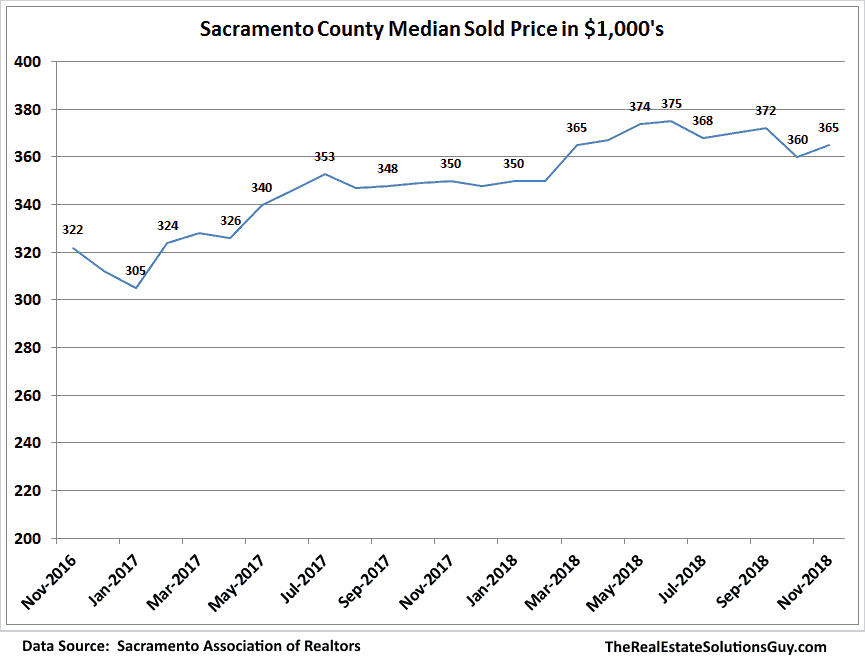
Median Home Prices Increase Year over Year
Median home prices increased from November of last year by 13% or $43,000. The median home price is the mid point between the highest and lowest priced homes sold. Median home prices are down slightly from the summer peak of $375,000 . This slight decline reflects the increase in inventory and declining buyer sentiment.